


1. INTRODUCTION
Tenofovir (TFV), a first-choice anti-viral agent, has been produced as various forms of TFV prodrugs to increase efficacy as well as reduce toxicity. One product of TFV, tenofovir alafenamide (TAF), was approved by FDA in 2016. TAF is sensitive to cathepsin A enzyme and carboxylesterase 1. Its stability contributes to decrease exposure and increase loading of TFV with improvement of safety and efficacy [1-3].
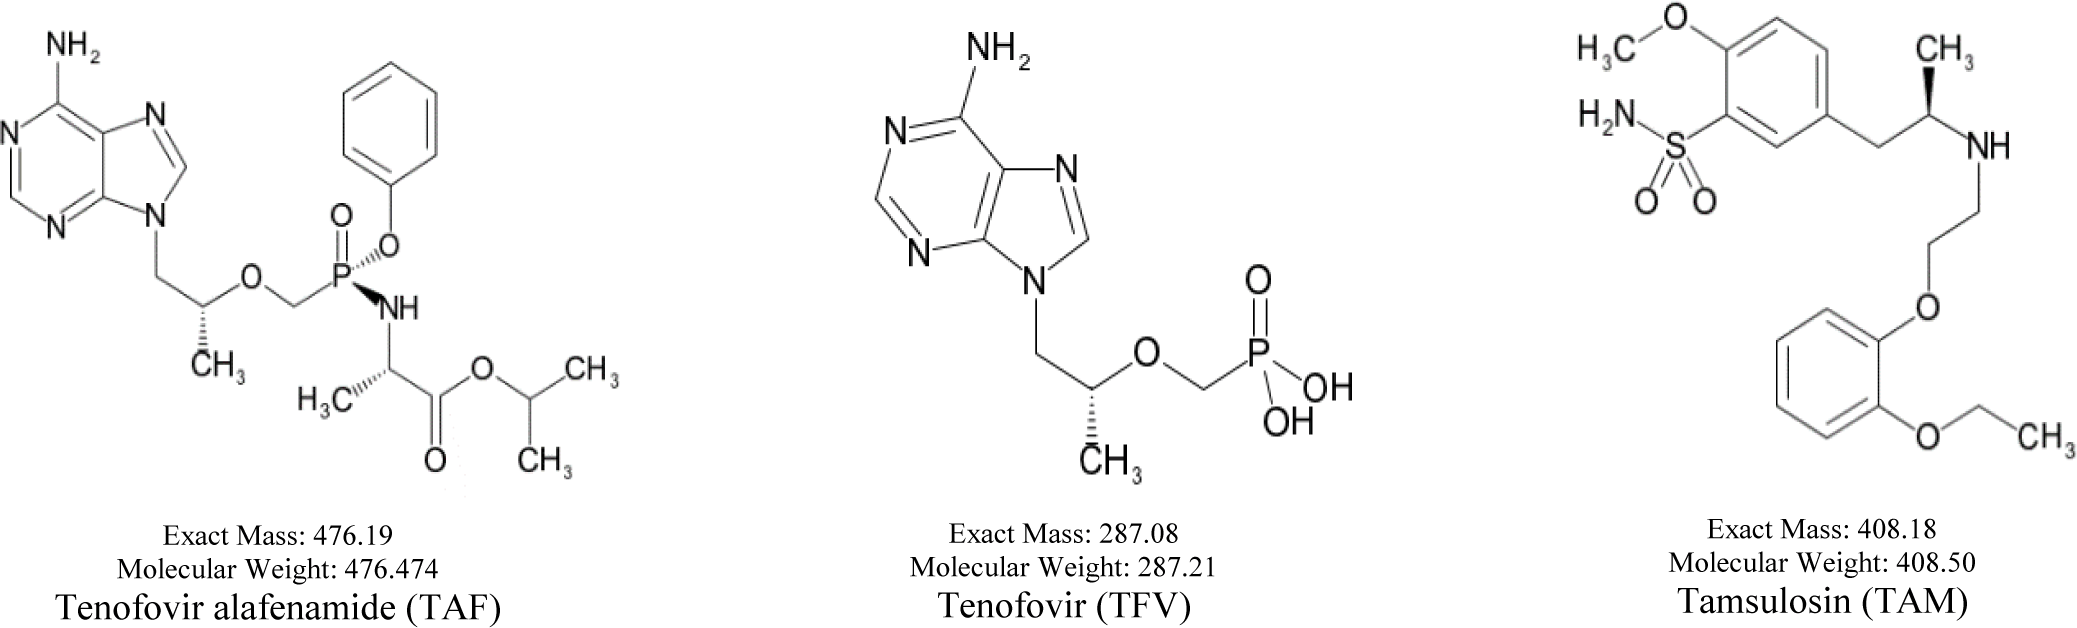
The Vietnamese market is currently circulating a tenofovir alafenamide generic. These formulations, however, have not been assessed for in vivo bioequivalence to the reference product. After oral administration, TAF is extensively converted into an active metabolite, TFV and a very low concentration of TAF can be found in plasma [1-3]. However, in human plasma, there are several liquid chromatography - tandem mass spectrometry (LC-MS/MS) methods that have been announced for simultaneous quantitation of TAF and TFV [4-8]. Therefore, in order to quantify simultaneously TAF and its metabolite, TFV, in human plasma, our purpose developed a reliable LC-MS/MS procedure and applied this method to evaluate the bioequivalence of a generic product in comparison with the reference product. The chemical structures of TAF, TFV, internal standard (IS) are shown in Figure 1.
2. MATERIALS AND METHOD
The reference standards were obtained from Sigma – Aldrich: tenofovir monohydrate (99.1%) and tamsulosin hydrochloride (100.0%) as internal standard. Tenofovir alafenamide salt (99.46 %), was purchased from AK Scientific. LCMS-grade acetonitrile was obtained from J.T. Baker. LCMS-grade ammonium formate was supplied by Fisher Scientific. Acetic acid, formic acid were of analytical grade and provided by Merck. Blank human plasma sources were purchased from Blood Transfusion Hematology Hospital Ho Chi Minh City, Vietnam and stored at below - 25°C prior to use.
Stock solutions of 100 μg/mL for TFV and TAF were prepared by dissolving a sufficient amount in mixture of methanol and water (1:1) and methanol, respectively. Standard solutions were prepared by diluting stock solutions in methanol at exact concentrations about 80, 240, 500, 1000, 2000, 5000, 8000 and 10000 ng/mL for TAF and 8, 24, 50, 100, 200, 500, 800 and 1000 ng/mL for TFV. Dilute working standard solutions in plasma to obtain calibration standard samples at approximately exact concentrations: 4, 12, 25, 50, 100, 250, 400 and 500 ng/mL for TAF; 0.4, 1.2, 2.5, 5, 10, 25, 40 and 50 ng/mL for TFV. The quality controls (QCs) in blank human plasma with low, medium and high concentration levels were 12, 250 and 400 ng/mL for TAF; 1.2, 25 and 40 ng/mL for TFV. The QCs were prepared separately from the stock standard solutions and working standard solutions. During the validation, fresh QCs and calibration curve were established on each day of analysis. A stock of 100 μg/mL internal standard (IS) solution was prepared by dissolving a sufficient amount of tamsulosin hydrochloride in methanol. Before analysis on each day, the 1000 ng/mL IS solution was prepared by diluting the IS stock solution in same solvent. Stock solutions of analytes and IS were stored at -20±2°C. The calibration curve and QC samples were stored at below -70°C.
All stored human plasma were thawed and allowed at 20°C temperature before analysis. Spiked exactly 500 μL of plasma containing the analytes into an eppendorf tube. Add 50 μL of 1000 ng/mL IS solution in the sample, follow by precipitation with 1 mL of acetonitrile. After vortexed for 1 minute, the samples were centrifuged at 16,000 rpm for 15 minutes at 4°C, then transferred the solution into a tube and then evaporated the solvent under a nitrogen flow at 40°C to obtain the residue. Dissolve the residue in 150 μL of mixture of methanol and water (2:8, v/v), vortex for 1 minute, ultrasonic for 5 minutes, centrifuge 4,000 rpm for 5 minutes at 0°C, filtered through 0.22 μm nylon membrane filter from Membrane Solutions and 5 μL of aliquot was injected into the analytical system.
The Shimadzu UHPLC Nexera X2 coupled with Triple Quadrupole Mass Spectrometer LCMS-8040 was used to set up the chromatographic conditions. The autosampler and oven temperature were maintained at 10°C and 40°C, respectively. HPLC separation of IS and analytes was performed with an Agilent Poroshell C6-Phenyl column (150 × 4.6 mm; 4 μm). A mobile phase including 0.5 % formic acid and acetonitrile was delivered 0’ (5:95), 3’ (5:95), 6’ (95:5), 8’(5:95), and 10’ (5:95). The flow rate was 0.7 mL/min. The injection volume was 5 μL.
The MS analysis was conducted in positive mode utilizing electrospray ionization (ESI). The interface voltage was set to 4,500 V, block temperature was 400°C, desolvation temperature was 220°C, nebulizer gas was 3 L/min, drying gas was 15 mL/min and dwell time per transition was 100 ms. The transitions of multiple reaction monitoring (MRM) for each analyte and IS, and their respective optimum MS conditions, including voltage potential and collision energy (CE), were summarized in Table 1. The quantitation was applied via peak area. Data acquisition and processing were performed by LabSolutions software for LC-MS/MS system.
The current procedure was validated in compliance with EMA and US-FDA guidelines [9-10].
One blank plasma sample with IS phase and six individual plasma samples at lower limit of quantification (LLOQ) from six lots of different plasma treated, were analyzed to investigate unknown peaks at the retention time of each analyte. The specificity was met if the blank plasma response was less than 20% of the LLOQ response and 5% of IS response for each analyte and IS, respectively.
Carryover was validated by successive injection of blank and LLOQ samples after injection of the upper limit of quantification (ULOQ) sample into the chromatographic system. Perform the above procedure 6 times. Carryover was accepted if it was less than 5% of IS response for the IS and less than 20% of the LLOQ for each analyte.
The calibration standard curve includes 01 sample as blank plasma, 01 sample with IS (zero) in blank plasma and 8 plasma samples with analyte standard. The investigated concentration ranges from 4.0 to 500 ng/mL for TAF and 0.4 to 50 ng/mL for TFV. Perform analysis of three calibration standard curves repeatedly. The calibration standard curves were described by linear equation: y = ax + b, where y is the peak area ratio of analyte and IS and x is the concentration of the analyte (μg/mL) and, then, the regression coefficient, slope and y-intercept of the resulting calibration standard curves were determined by least squared weighted (1/x2) regression.
Prepare a sample lot consisting of 4 concentrations of LLOQ, LQC (low level quality control), MQC (medium level quality control) and HQC (high level quality control), each with 6 concentrations. Processing and analyzing according to the developed method. Repeat for another 2 days. Intra-day (n = 6) and inter-day (n = 18) accuracy and precision were evaluated. The accuracy were accepted if the back calculated concentration was 15% deviation from the nominal concentration for QC and 20% for the LLOQ. The precision were accepted if the CV (coefficient of variation) did not exceed 20% for LLOQ and 15% for each QC.
Prepare six individuals plasma from six lots of different plasma, each batch two samples, and conduct sample extraction according to the sample treatment process. After treatment, the working standard solution containing analytes was added in the sample at two concentrations of LQC and HQC to each batch, to calculate the influence of sample matrix. Plasma samples were tested at LQC and HQC. The matrix effect for each analyte and IS were separately evaluated in each sample by determination of the peak area ratio of post-extraction spiked plasma and spiked methanol.
Three series of six samples with concentrations from quality control samples (LQC, MQC, HQC) of the standard curve were separately prepared and analyzed. Then, the ratio of recorded peak area to peak area obtaining from injecting directly the solutions in methanol of the analytes with the same concentrations were calculated as percentage in each case.
Prepare plasma samples at concentrations of exactly 400 ng/mL for TAF and 40 ng/mL for TFV. These samples were then diluted twofold with blank plasma in 6 replicates and analyzed. Precision and accuracy of these samples within 15% deviation was accepted.
Freeze and thaw stability: LQC and HQC plasma samples were stored at -70°C for 1 day and thawed at room temperature (one cycle). The cycle was replicated three times and, then analyzed the samples.
Short-term temperature stability: LQC and HQC plasma samples were stored at 20°C (room temperature) for 6 hours before analyzed.
Long-term stability: LQC and HQC plasma samples stored at -70°C were measured for a period of 60 days.
Post-preparative stability: The autosampler steadiness was validated by measuring the extracted LQCs and HQCs kept under the autosampler situations (10°C) for 24 hours.
The informed consent forms were accepted by the Independent Ethics Committee of Institute of Drug Quality Control Ho Chi Minh City, Vietnam. Prior to attend the study, 44 subjects were received informed consent and 36 subjects were selected based on inclusion criteria to participate in the study. This was a single-center, open-label, randomized, two formulation, two period, two sequence, single dose, crossover study in healthy subjects under fed condition. A total of 36 healthy subjects were randomized to two groups, taking a single oral dose of tenofovir alafenamide 25 mg with 240 mL of water for each period. Subjects receiving one tablet of tenofovir alafenamide 25 mg tablets (test formulation) in treatment period 1 would receive one tablet of VEMLIDY® tablets, manufactured by Gilead Sciences, Inc. (reference formulation) in treatment period 2 and vice versa. There was a 07-day washout period between the two treatment periods. Each period was 04 days. Following aseptic techniques, a catheter was inserted and then blood samples were drawn for quantitation.
In the trial under fed conditions, 5 mL of blood were drawn 0 h, 0.17 h, 0.33 h, 0.5 h, 0.67 h, 0.83 h, 1.0 h, 1.25 h, 1.50 h, 1.75 h, 2.0 h, 2.5 h, 3.0 h, 4.0 h, 8.0 h, 12.0 h, 24.0 h, 48.0 h and 72.0 h. The collected blood samples were centrifuged at 4,500 rpm for 10 minutes at 4°C and each of the sample was transferred into two polypropylene vials (one sample for analysis and one sample for backup) which had contained 30 μL of 30% formic acid on dry ice. The vials were capped and vortexed for 10 s. Finally, all samples were kept at −70°C until quantitation.
3. RESULTS
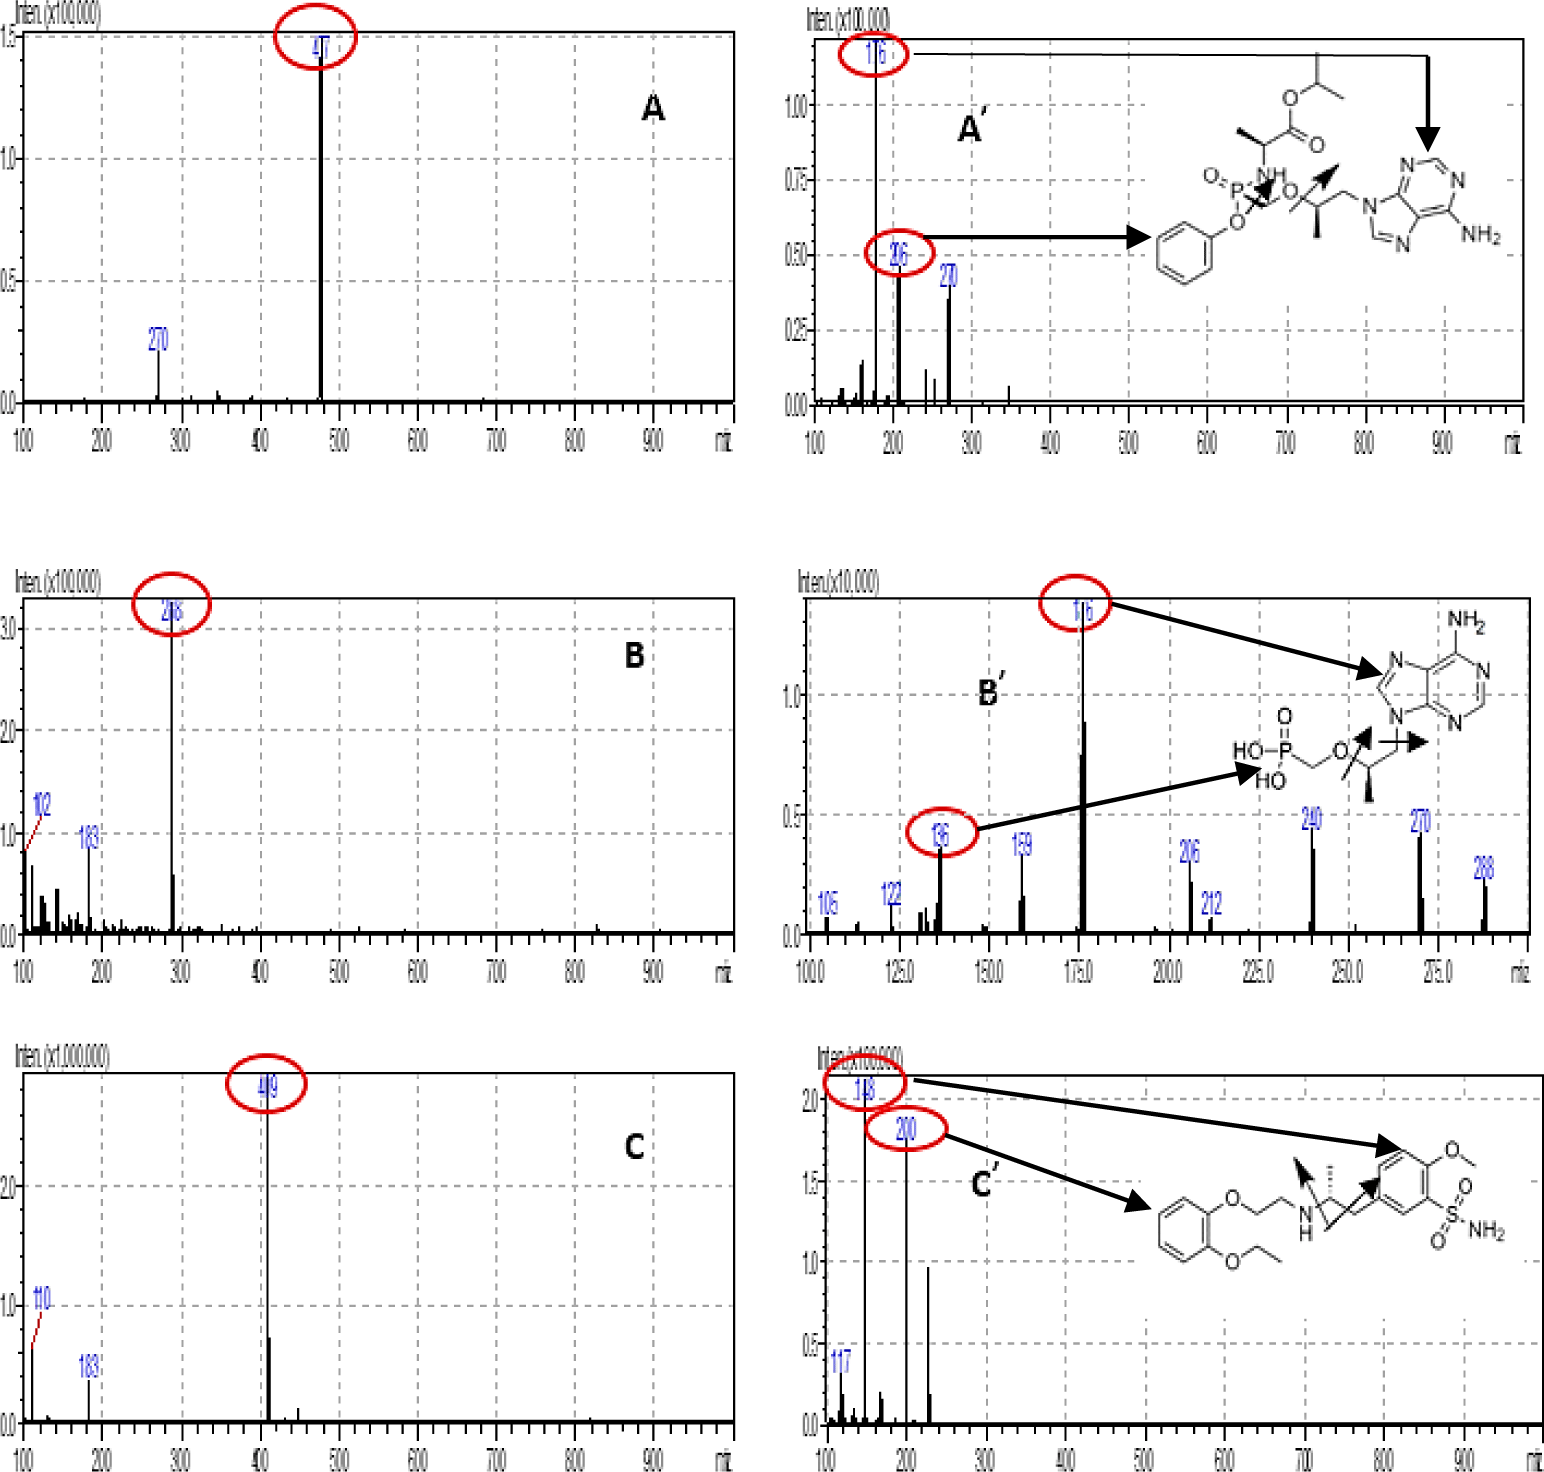
In order to optimize ESI conditions for TAF, TFV and IS, full scans were conducted in positive detection mode. The MS full scan spectra for TAF, TFV and tamsulosin (IS) contained [M+H]+ ions at m/z 477.10, 288.10 and 409.20, respectively.
The most intensive daughter ions in MS spectra for TAF, TFV and tamsulosin (IS) were recorded at 176.00, 176.00 and 148.10, respectively. The fragment ions of TAF, TFV, and TAM are suitable with the published prestigious publications [4,5,7] and complied with Euro massbank. Figure 2 shows the Q3 MS spectra m/z of the analytes and IS. The MS/MS parameters were systematically optimized for each analyte and IS in order to acquire a consistent and adequate response. A dwell time of 100 ms was sufficient.
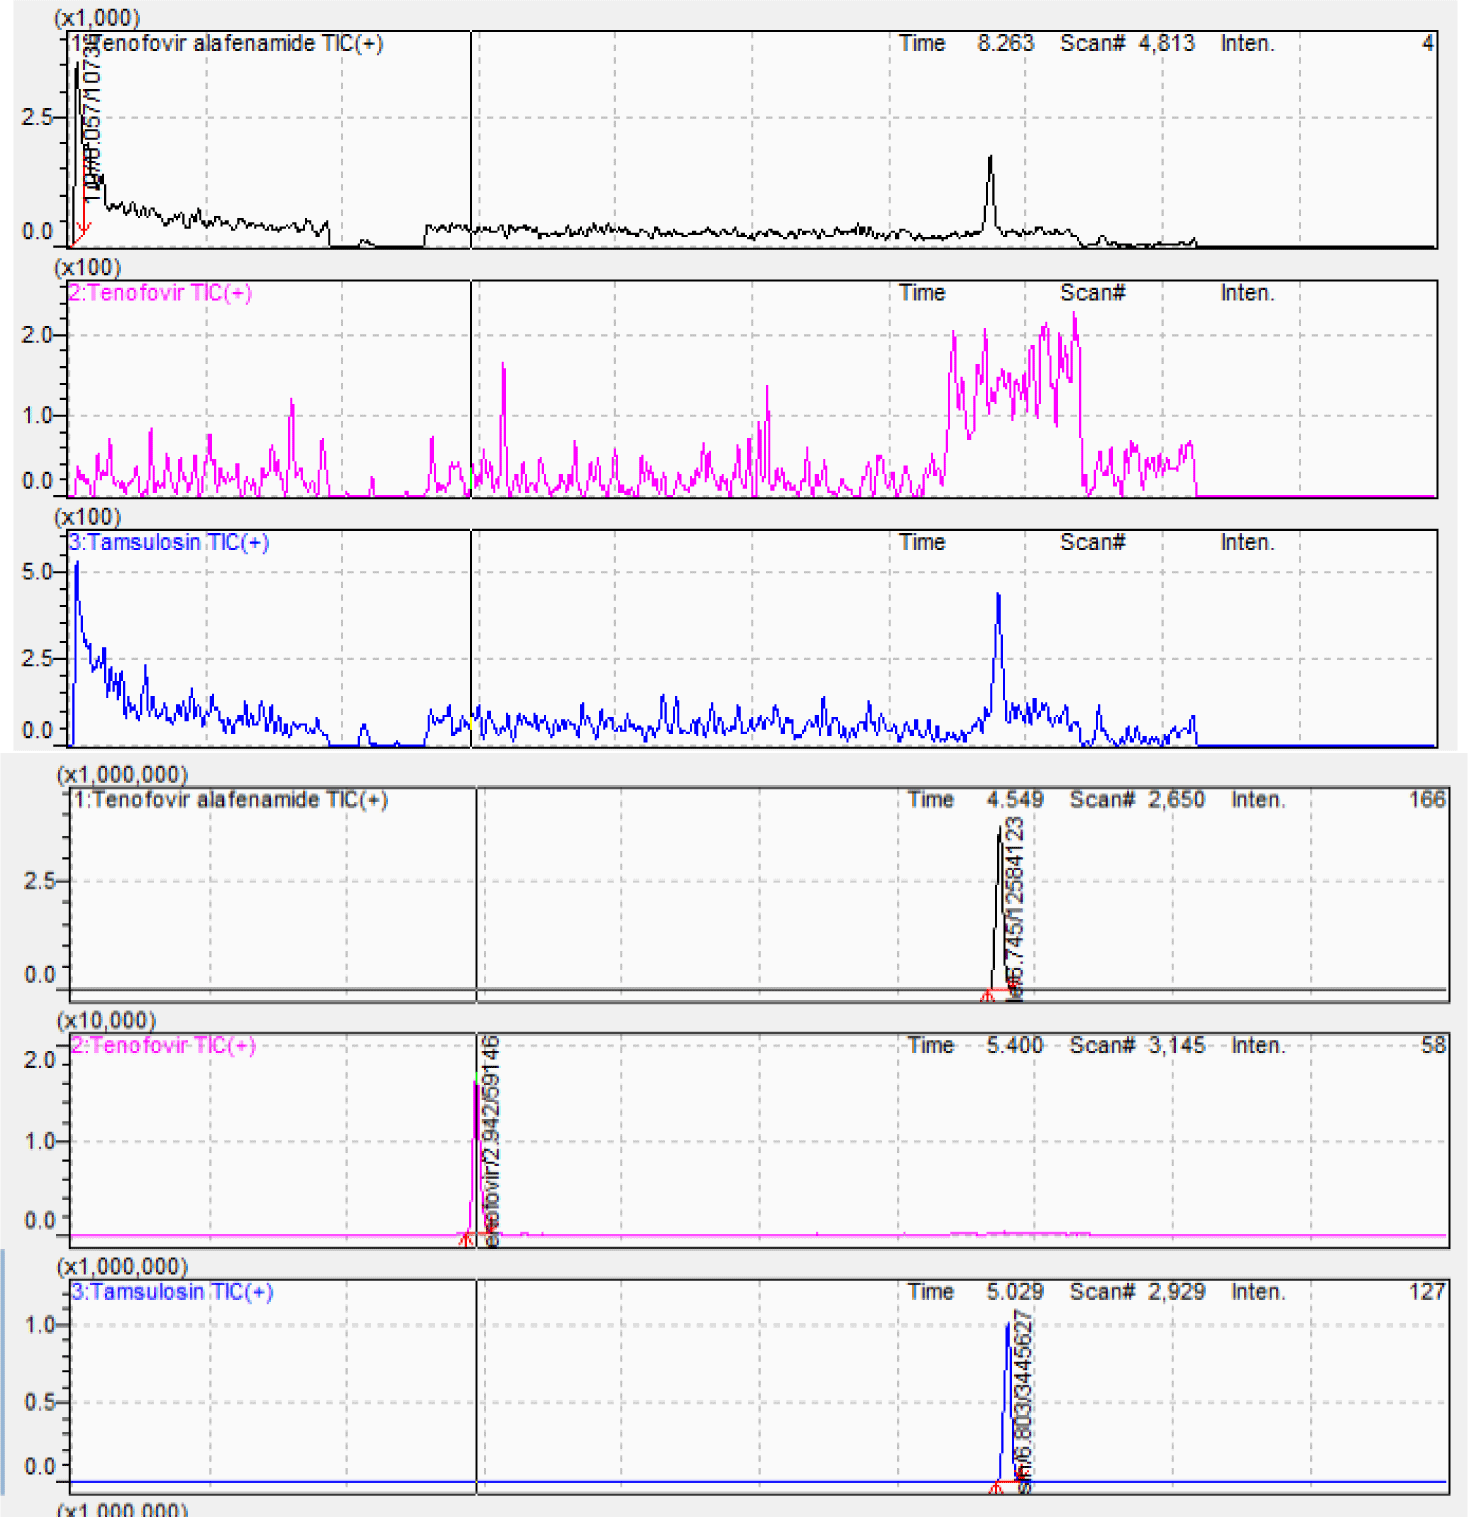
The chromatographic separation was the challenge due to the differences in polarity among TAF, TFV, and IS. Chromatographic conditions were investigated by considering the mobile phase component, concentration of the acid solutions and strength, column type, column oven temperature, flow rate, and injection volume. Thus, these parameters were initially changed to obtain a short retention time, minimum matrix interference, low solvent consumption, and good peak shape. Based on the outcome of various trials, the Agilent Poroshell C6-Phenyl column (150 × 4.6 mm; 4.0 μm) was selected. The mobile phase containing acetonitrile and 0.5% formic acid solution at 0.7 mL/min flow rate ensured separation of TAF, TFV and IS at the retention times of 6.88 min, 2.94 min, and 6.95 min, respectively in a total run time of 10 min. Figure 3 shows the chromatograms of blank plasma and analytes at MQC level with IS. Blank plasma chromatogram was obviously clean without unknown peaks at the retention times of analytes and IS.
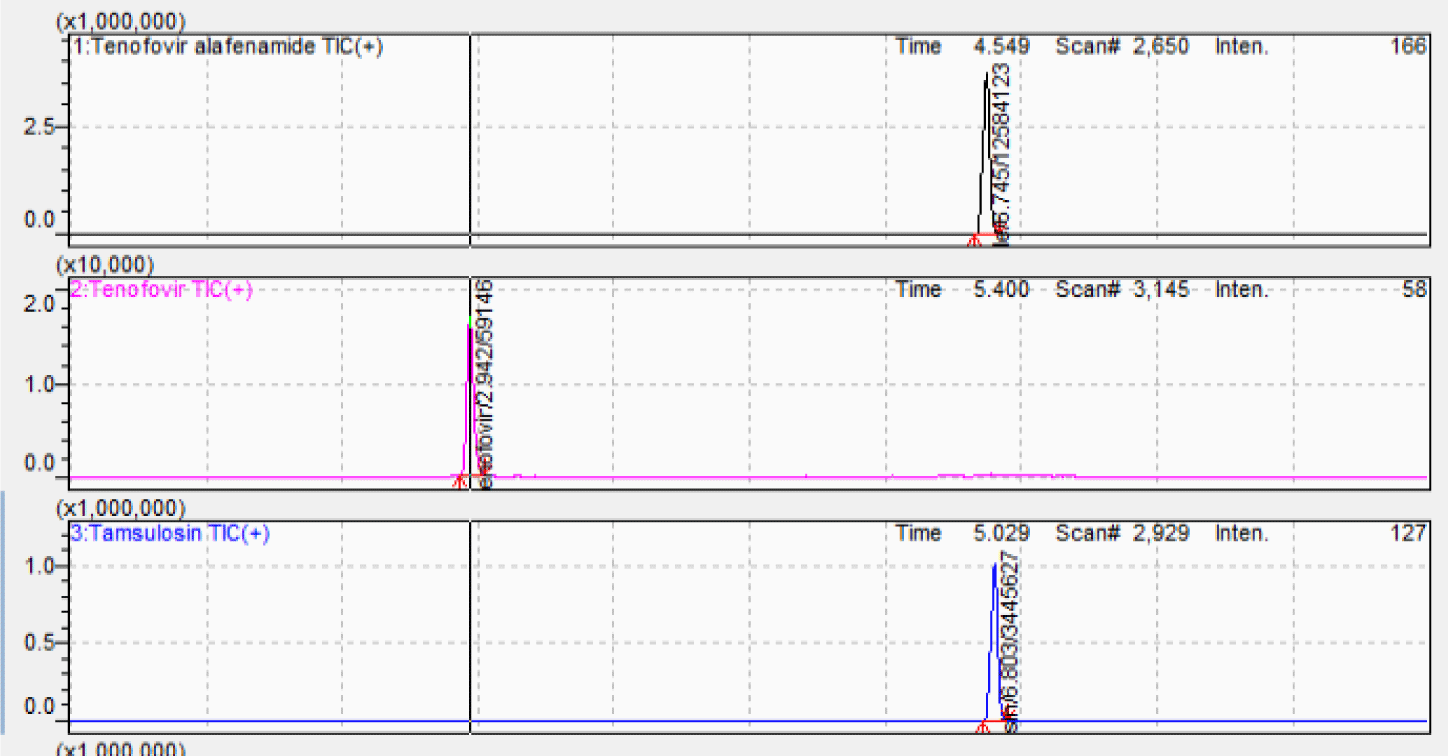
Protein precipitation technique (PPT) is routine sample pretreatment technique. During the initial stages of method development, PPT was carried out using methanol and acetonitrile as agents. As a result, acetonitrile was selected to obtain a clean extract and lower background noise with high sensitivity. Figure 4 shows the chromatogram of analytes at MQC level with IS at optimum extraction procedure.
The procedure met validation criteria in accordance with US-FDA and EMA guidance. The results of method validation are provided in Table 2.
Carryover evaluation was carried out to ensure the precision and accuracy of the procedure are not affected. The carryover for the analytes and IS was within the acceptance limit. No interfering peaks co-eluted with analytes and IS after subsequent injection of ULOQ were detected.
The calibration curves were validated over the following ranges: 4-500 ng/mL for TAF and 0.4-50 ng/mL for TFV. The calibration lines were drawn to give the linear regression equations: y = 0.0211x+ 0.1163 and y = 0.0016x - 0.0009 for TAF and TFV, respectively. The correlation coefficient square (R2) was more than 0.99. The accuracies were in the range of 91.85%-109.01% and 96.94%-105.76% for TAF and TFV, respectively, which met the requirements. The LLOQ in the calibration curve with acceptable precision and accuracy, was 4 ng/mL and 0.4 ng/mL for TAF and TFV, respectively, at a signal-to-noise ratio of more than five.
The precision and accuracy for all analytes met the acceptable criteria. The intra-day accuracy was within 89.92%-114.03% and the intra-day precision (CV) varied from 1.00% to 9.60% for all analytes. Similarly, the inter-day accuracy was in the range of 87.74%-114.51% and the inter-day (CV) varied from 3.98% to 11.67%.
Following a 2-fold dilution for samples higher than ULOQ, the accuracy was within 100.10%-103.30% and the precision (CV) ranged from 1.69% to 4.08%, which was within the acceptance limit.
The stabilities of the analytes and IS in plasma and stocks were investigated. Analytes were stable for 6 hours at 20°C temperature and for three freeze and thaw cycles at below - 70°C. Spiked plasma samples were found stable for a period of 60 days after long-term stability experiment. Autosampler stability was carried out and found that the spiked samples were stable for 24 hours without loss of the analytes at 10°C.
Response of analyte were stable in plasma at 20°C (room temperature for 6 hours), after three free-thaw cycles, after 60 days of storage at -70°C, and in the autosampler set at 10°C in 24 hours. Additionally, responses of analyte in stored stock were within 15% deviation of responses of the fresh solution that were accepted.
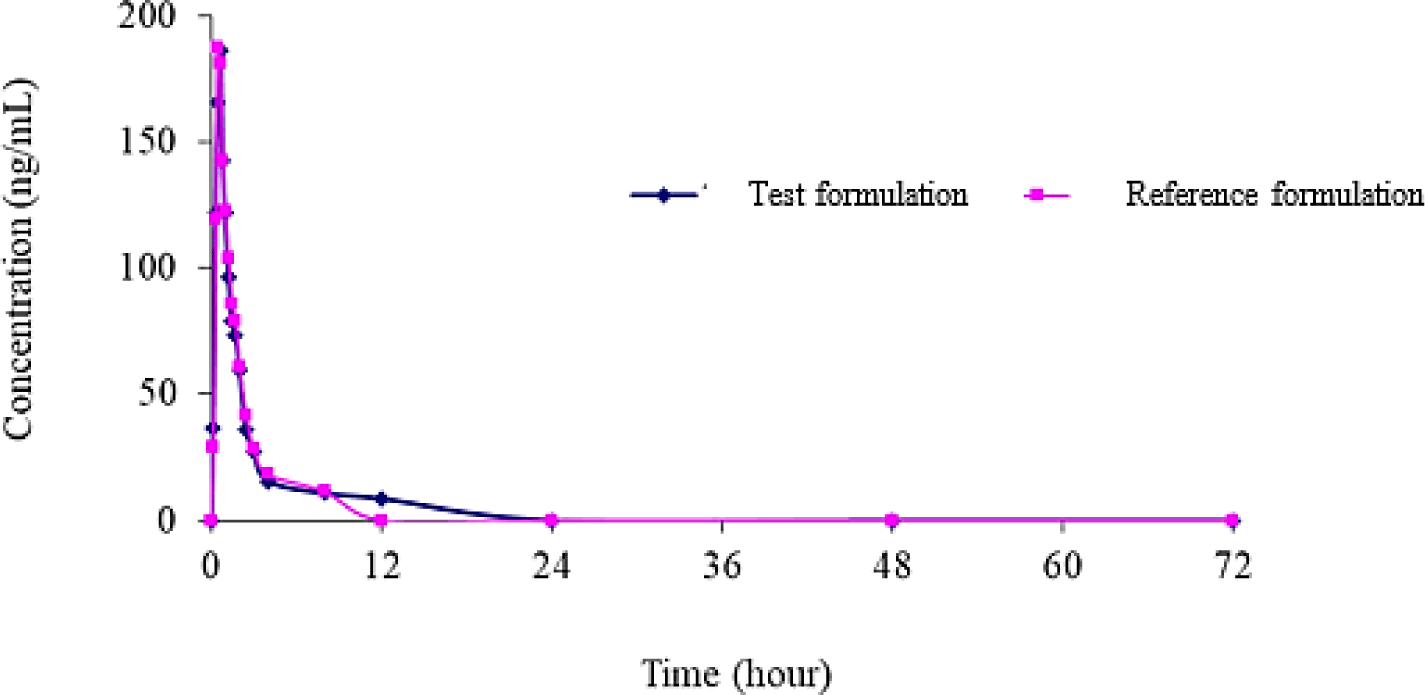
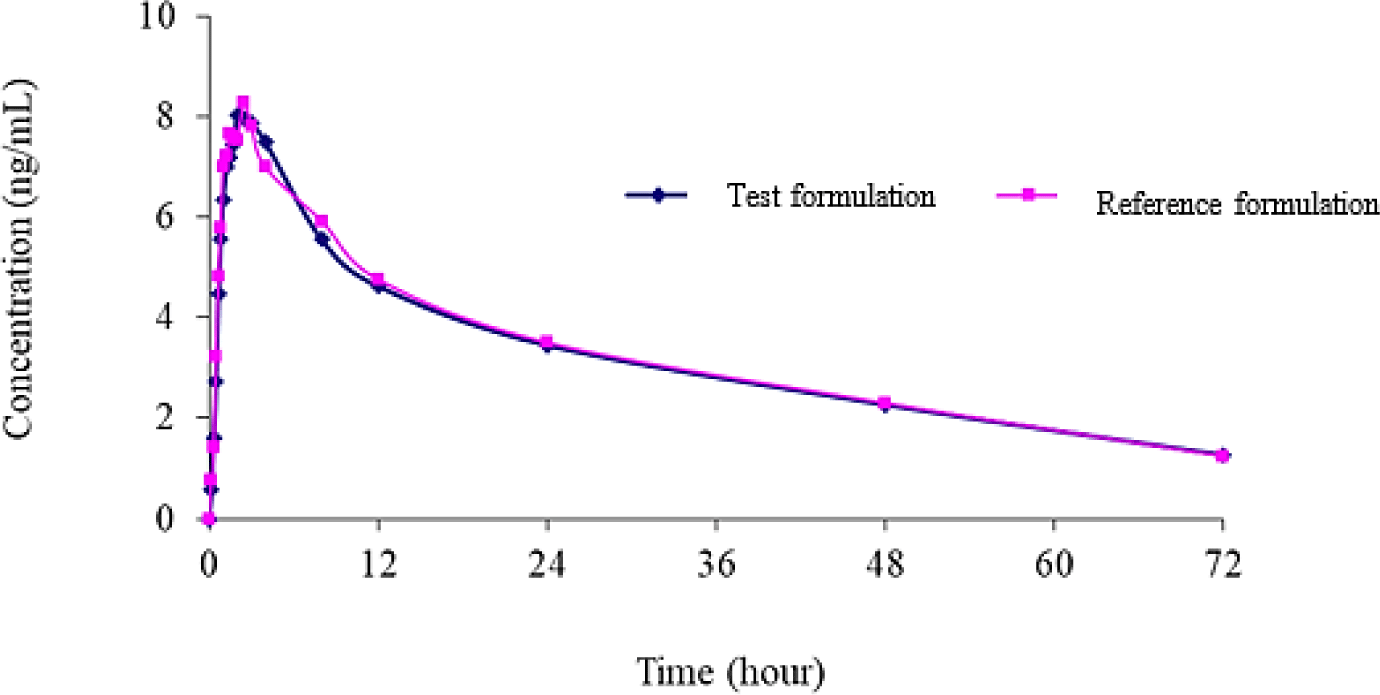
The 90% confidence intervals of TAF and TFV for the ratios of pharmacokinetic parameters of generic product to reference formulation were shown in Table 3 and Table 4, respectively. Mean plasma TAF and TFV concentration-time curve of test to reference formulations were shown in Figure 5 and Figure 6, respectively.
4. DISCUSSION
The Q1 (−)ESI spectra of TAF, TFV and TAM showed the intense [M+H]+ ion at m/z 477.10, 288.10 and 409.20 Quantitative determination was performed by MRM mode of transition from precursor to product ions at m/z 477.10 → 176.00 for TAF, m/z 288.10 → 176.00 for TFV and m/z 409.20 → 148.10 for TAM, with 100 ms dwell time per transition. These fragment ions were selected as quantified ions for TAF, TFV and TAM because they had the highest signal among daughter ions for each analyte. The current CE optimization step was critical for the selection of the final MRM transitions for TAF and TFV.
Antiretroviral drugs were commonly used as IS for nucleoside analogs quantitation besides isotopic compounds. Adefovir, acyclovir and lamivudine were initially selected because these compounds have similar structure with tenofovir. However, in our conditions, these analogue were abandoned subsequently for its poor chromatographic shape and unstable MS intensity. After several experiments, tamsulosin was selected for IS, as it exhibited higher quantitative accuracy and lower analytical variation.
Based on the previous literature [4-8], the starting conditions for finding the appropriate LC parameters were selected. C18 and C6-phenyl columns were used to obtain acceptable resolution with good peak shape such as XSelect HSS T3 C18, XBridge C18, Zorbax C18, Waters Acquity UHPLC HSS T3 C18, Acquity UPLC HSS PFP Pentafluoro C6-Phenyl, and Phenomenex Synergi Polar-RP C6-Phenyl columns. In this study, based on the available conditions of our laboratory, Agilent Poroshell C6-Phenyl (150 x 4.6 mm, 4 μm) column was chosen because it offered a good separation efficiency with short analysis time and popularity. Agilent Poroshell C6-Phenyl columns are produced based on superficially porous particle technology, which features a solid silica core and a porous outer layer. Compared to traditional total porous particles of the same (or similar) size, Poroshell particles deliver higher chromatographic efficiencies and enable fast, high resolution separations. Poroshell superficially porous particles offer several advantages over totally porous particles such as uniform particles with smooth surfaces, ensuring smaller particle size distributions, short analyte diffusion path in/out of the porous layer, narrow particle size distributions, allowing more uniform packing of column particles. The C6-phenyl column was selected for analysis because of the selectivity of the stationary phase for the analytes, as demonstrated by the interaction between the π electrons of the phenyl ring of the stationary phase with the π electrons of the aromatic ring of the analyte and the internal standard. The π-π interaction is a type of electron donor and acceptor interaction that can occur during chromatography between the stationary phase and the analyte. This interaction is stronger than the Van der Waals interaction and equally important than other interactions such as hydrogen bonding, dipole-dipole interactions, can lead to increased retention of polar aromatic compounds of other alkyl bonded stationary phases such as C18.
The optimization of LC condiditions was concentrated on the mobile phase component as well as pH of buffer and strength, oven temperature, flow rate, injection volume and, stationary phase. Formate buffer, formic acid, and pH of the buffer were selected in this study. The mobile phase of acetonitrile-ammonium formate buffer, acetonitrile-formic acid solution at different concentrations, pH and ratios were investigated. In the investigated formic acid concentration range, the retention time of TFV, TAF and TAM was not affected. The higher the formic acid concentration, the higher the signal strength of the analytes are almost unchanged from the 0.5% formic acid concentration. When formic acid concentration varies from 0.1% to 0.5%, the analyte and internal standard peaks have asymmetry factor below 1.5 but at 0.7% formic acid concentrations, the TFV peak has an asymmetry factor more than 1.5. When using the acetonitrile mobile phase – 0.5% formic acid solution (gradient program), the TAF and TFV analytes were completely separated, short analysis time, low column back pressure and high response signal. Additionally, the optimization of oven temperature, flow rate and injection volumn were carried out to determine reasonable chromatographic conditions. In the investigated column temperature range, the retention times of TFV, TAF and TAM are not affected and the signal strengths are almost unchanged. At column temperature 40°C, the analytes and internal standards have asymmetry factor less than 1.5. Therefore, the column temperature at 40°C was selected. When the flow rate increases, the retention times of analytes and internal standards reduce. The flow rate of 0.7 mL/min was chosen because the asymmetry factor, peak height, and retention times of analytes are suitable. When the injection volume increases from 3 to 5 μL, the analyte signal increases rapidly, the asymmetry factor of the analytes do not change significantly. When the injection volume increases from 7 to 10 μL, the analyte asymmetry factor is greater than 1.5. In addition, when the sample injection volume was 3 μL, at the LLOQ concentration, the signal-to-noise ratio of the TFV was low (S/N = 3.5) against a sample injection volume of 5 μL. Therefore, a sample injection volume of 5 μL was chosen. Analytical results showed that the TAF and TFV analytes were eluted early, completely separated, short analysis time and low operating pressure. Once the method was optimized to select suitable chromatographic conditions and was fully validated to demonstrate the final procedure was suitable for our purpose.
Previous publications [4-8] have described several sample treatment methods for quantitation of TAF or TFV in plasma. Quantitation of tenofovir alafenamide and tenofovir in animal and human plasma by LC-MS/MS utilizing solid phase extraction (SPE) technique was reported and became well used. Development of sample treatment methods that are compatible to LC-MS/MS has become high demand now. In this research, a sample treatment process was developed with these methods. The SPE is simple, efficient and easy to automate but it is expensive, so it was not preferred with condition of our laboratory. Two methods of protein precipitation (PP) and liquid-liquid extraction (LLE) were investigated to optimize sample cleaning to reduce matrix influence, increase extraction recovery and prolong the life of the analytical column. Initially, LLE is compatible with ESI because it well desalts samples. The LLE provided further simplified sample preparation steps, samples after treatment were cleaner, the dilution was less, so the sample was concentrated to increase the signal of analytes, suitable for low analytes concentration in human plasma. However, due to differences in polarity of TAF, TFV and TAM, it was challenge to balance the polarity of these three compounds, leading to low extraction recovery (below 30 % for TFV), and CV > 15%. The PP is an old but effective method to treat plasma samples. The PP was chosen due to the advantages of easy operation, less time consuming, less solvent, and leading to high extraction recovery. The use of buffer solutions according to the references to break protein bonds to stabilize the analytes in the plasma sample matrix increased the extraction efficiency of the analytes. Experiments showed that the extraction efficiency of the analytes was high and stable, ensuring that the PP method can be applied for quantitation of TAF and TFV in the plasma samples of volunteers later in bioequivalence studies.
Hummert P. reported that “TAF appeared to be unstable after 72 hours in injection matrix and was only stable in mouse plasma for two freeze-thaw cycles” [8]. Ocque AJ. validated “LC-MS/MS methods for TFV and TAF in human plasma without mention of stability challenges” [5]. Zhao L. found that “the TFV concentration in the untreated plasma samples increased during the storage period, due to the conversion of TAF to TFV in weakly alkaline plasma, and that the addition of 2% acetic acid to human plasma prevented the conversion and enabled validation of the method for simultaneous determination of TAF and TFV in human plasma” [7]. However, incurred sample reanalysis (ISR) data were not provided, and it was not known if the stability of TFV were validated in the TAF presence. Xiao D. developed method for the TFV determination following administration of TAF involved two differences from TFV determination following administration of TDF [4]. However, this method was not used to evaluate the bioequivalence of two drug products containing 25 mg tenofovir alafenamide.
At the initial experiments, the TFV concentration increased during the storage of plasma. This can be explained from the fact that TAF belongs to phosphoranidate compound group. Therefore, it can transform to TFV in plasma under weakly alkaline condition. Stability of analyte must be ensured from the stage of sample collection, treatment, storage, to one of analysis to generate precise and accurate analytical data. In order to select formic acid (FA) or acetic acid (AA), experiments on investigation of acid concentration, acid and plasma ratio were performed to achieve the satisfied selection that can inactivate plasma esterases, and the application ease during sample collections. In our study, TAF was not transformed to TFV by using formic acid to 30% volume into plasma samples and that were experimentally proved by preparing normal plasma sample and other one acidified by formic acid. After storage at −70°C for 60 days, the samples were evaluated, formic acid successfully prevented the conversion and it was selected for further method development. The TFV concentration increased significantly and the TAF one declined in the normal plasma samples. As a result, the plasma acidified with 30% volume of formic acid inhibited the conversion from TAF to TFV.
For quantification of TAF and TFV in plasma, most of published articles involved a relatively expensive solid phase extraction and LC-MS/MS with LLOQ within the range of 0.5-1.0 mg/mL for TFV [4-8]. There are only one study with LLOQ of 0.4 ng/mL for TFV using LC-MS/MS [7]. The stable isotope-labeled internal standards d5-tenofovir alafenamide, d6-tenofovir and adenine-13C5 used in these studies are also relatively expensive. Additionally, consumption of high amounts of solvents, state-of-the-art instruments and equipment and extraction procedure time are drawbacks of these studies.
We developed and optimized another novel quantitative method using a simple, rapid, economic and easy-to-apply protein precipitation (PPT) technique for simultaneous quantitation of TAF and TFV in plasma. The new method is highly applicable and appropriate for quantification of human plasma samples collected from bioequivalence studies of generic drugs containing tenofovir alafenamide at various strengths in pharmaceutical market. The method can be applied at a small to medium sized laboratory at a low-operating cost. Comparing to other researches [4-8,11-12] on the requirements for method validation such as the time analysis, LLOQ, linearity, accuracy and precision, the free-thaw stability and recovery, our method’s LLOQ is lower than reported paper. Moreover, the TFV stability in K2EDTA plasma treated by formic acid either in TAF absence or in TAF presence has been evaluated.
Conclusion
A simple, rapid, and economic LC–MS/MS procedure for simultaneous quantitative determination of TFV and TAF in human plasma was developed with the LLOQ of 0.4 ng/ml and 4 ng/ml for TFV and TAF, respectively. The validated procedure has been applied to the in vivo bioequivalence study and the obtained results have been satisfied. It proves that the procedure is sensitive, specific, and suitable for sample analysis.