1. INTRODUCTION
Hypertension is a growing global health crisis, projected to affect 1.56 billion people by 2025, and remains a leading cause of preventable mortality worldwide [1]. In Vietnam, a 2019 systematic review and meta-analysis reported a pooled hypertension prevalence of 21.1% based on ten relevant studies. When restricted to three nationwide surveys, the pooled prevalence was slightly lower, at 18.4% [2]. Hypertension contributes to approximately 91,600 deaths annually in Vietnam and is responsible for 7.2% of years of life lost due to disability, primarily through its role in increasing the risk of stroke and cardiovascular disease [3].
While well-established risk factors are widely recognized [4–8], ethnic minority populations may face additional or unique risk exposures. The K’Ho, one of Vietnam’s ethnic minority groups, primarily reside in the Southern Central Highlands, including Lam Dong Province [9]. Cultural practices in this community such as frequent, prolonged festivals involving high alcohol consumption and a traditional diet that includes large amounts of pickled foods may elevate their risk for hypertension [10,11].
Despite these concerns, limited research has been conducted on hypertension prevalence and its determinants within the K’Ho population. To address this gap, the present study aimed to assess the prevalence of hypertension and identify associated risk factors among the K’Ho people living in Lien Dam Commune. A better understanding of these factors is essential for informing culturally appropriate prevention and management strategies tailored to this underserved population.
2. METHODS
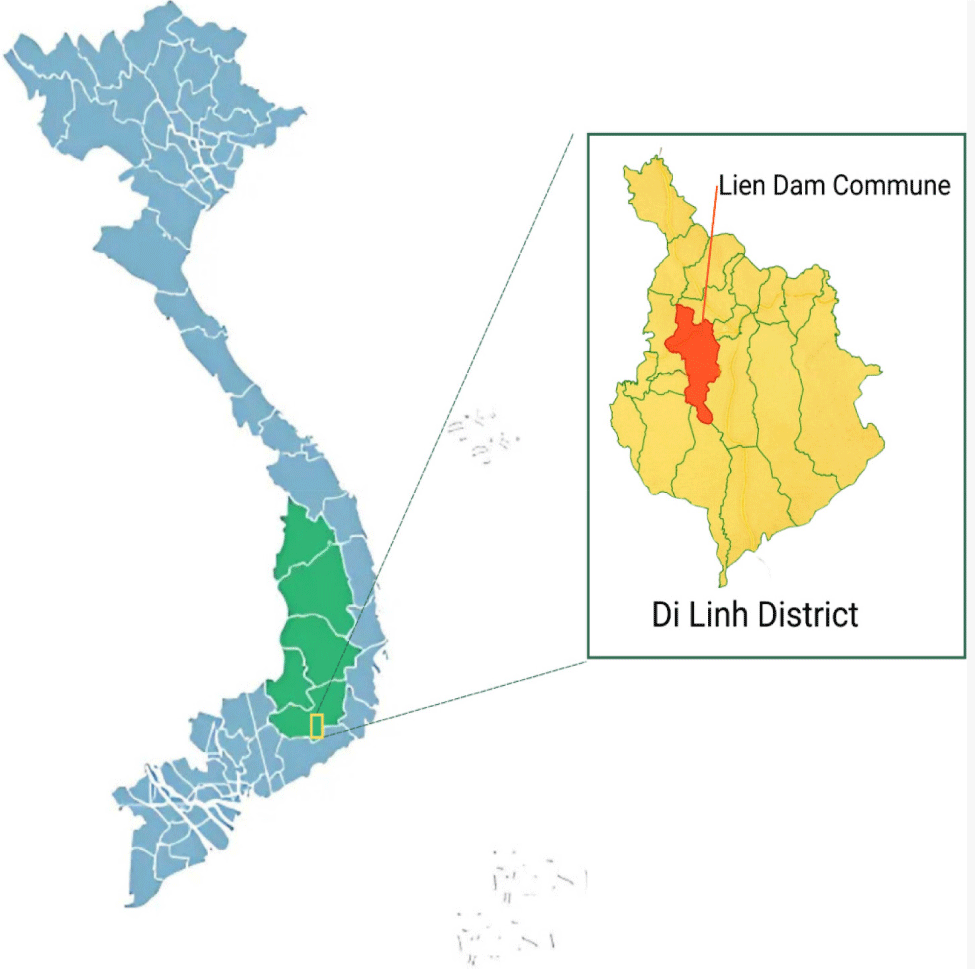
A cross-sectional study was conducted from February to June 2021 in Lien Dam commune, Di Linh district, Lam Dong province, Vietnam (Fig. 1).
K’Ho individuals aged 25 to 64 years, residing in Lien Dam commune during the study period, were eligible for inclusion. Individuals who were deaf, blind, severely ill, or pregnant (due to the potential for inaccurate anthropometric measurements) were excluded.
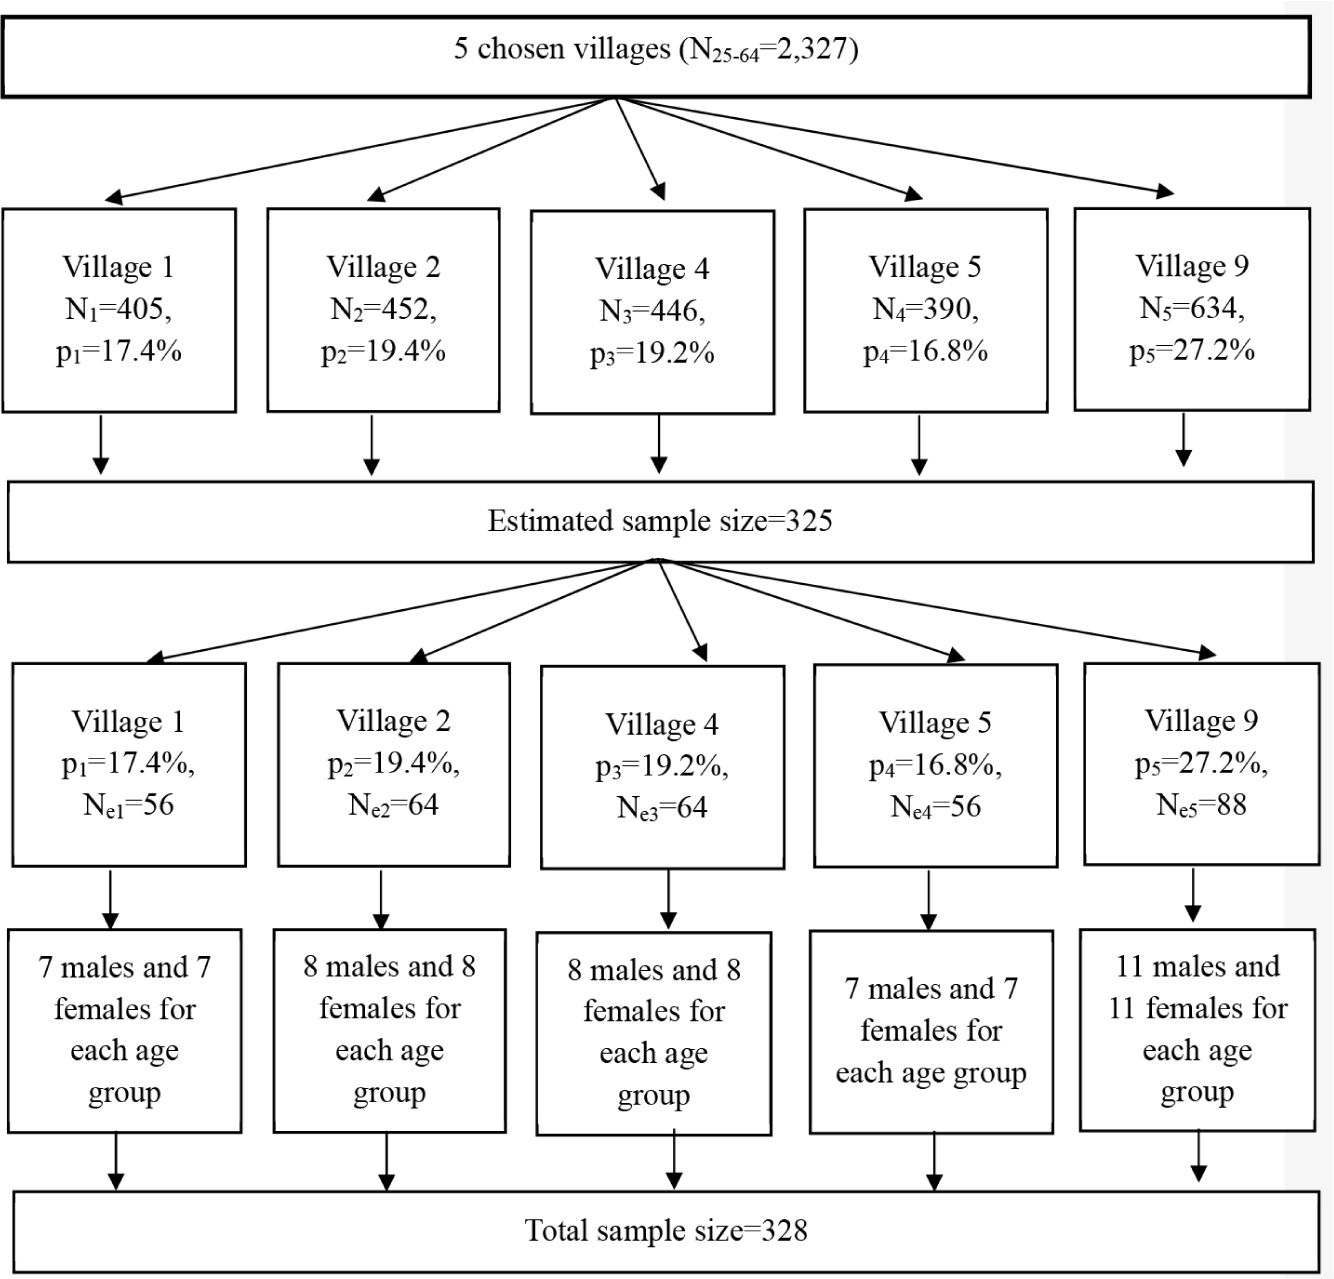
A minimum sample size of 325 was calculated using the formula for estimating a proportion in cross-sectional studies. This calculation was based on a hypertension prevalence of 30.3% reported from a 2018 study conducted across 10 cities/provinces in Vietnam [12], a margin of error of 0.05, and a significance level (α) of 0.05.
Stratified random sampling was employed. A list of all eligible K’Ho individuals aged 25 to 64 years residing in Lien Dam commune was provided by the local authority. Then, they were stratified across five randomly selected villages. Sample sizes for each stratum were allocated proportionally (16.8%–27.2%), with 56–88 individuals per village. Within each stratum, participants were selected to achieve equal representation by sex (male, female) and by age group (25–34, 35–44, 45–54, 55–64). All eligible individuals selected from the sampling method received personal invitation and agreed to participate in the study, resulting in a final sample size of 328 (Fig. 2).

To reduce selection bias, participant recruitment followed strict inclusion and exclusion criteria. Local health workers and community leaders were actively involved in contacting and inviting eligible individuals to participate. The informed consent was obtained after a thorough explanation of the study objectives and procedures. Interviewers were rigorously trained, and quality control included detailed questionnaire design, regular data checking, and verification. Collected questionnaires were reviewed within 24 hours to ensure completeness and accuracy. If any item was missing, the interviewer would trace back the participant’s ID, contact them, and confirm the information. Data for analysis, therefore, included complete questionnaires only; later data imputation was not necessary.
Data were collected via face-to-face interviews using a structured 19-item questionnaire, covering: general information (6 items), lifestyle behaviours (8 items), anthropometric and blood pressure measurements (5 items) (Supplemental Table 1). Prior to data collection, eligible participants were contacted in advance by local health workers and scheduled for a home visit at their convenient time. All interviews and measurements were conducted at the participant’s homes to ensure comfort and enhance participation. Anthropometric measurements included height, weight, waist, and hip circumference. Blood pressure was measured using a Microlife® A2 Classic electronic sphygmomanometer, weight was measured using a digital scale, height was measured using a stadiometer, and waist and hip circumferences were measured using a tape measure. All measurements were taken at the start of the data collection process.
Blood pressure was measured with participants seated upright on a chair with back support, feet flat on the floor, legs uncrossed, and arms supported at heart level. The cuff was placed 2–3 cm above the elbow crease. Two readings were taken at five-minute intervals. If the difference between systolic readings exceeded 25 mmHg or diastolic readings exceeded 15 mmHg, a third measurement was taken. The average of all valid readings was used for analysis.
The primary outcome was hypertension, defined as systolic blood pressure greater than or equal to 140 mmHg, and/or diastolic blood pressure greater than or equal to 90 mmHg [13]. Body mass index (BMI) was categorized using Asia-Pacific standards of the International Diabetes Federation and the World Health Organization Western Pacific Region [14]. Waist-to-hip ratio cut-offs for high risk were greater than or equal to 0.90 for men, and greater than or equal to 0.80 for women [15]. A salty diet was defined as eating salty foods three or more days per week. Binge drinking was defined as five or more standard drinks per occasion for men, and four or more for women [16].
Data were entered using EpiData 3.1 and analysed using Stata 14. Descriptive statistics were used to summarize participant characteristics. Associations between hypertension and categorical variables (sex, religion, occupation, education level, BMI classification, waist-to-hip ratio classification, salty diet, alcohol consumption in the last 12 months, binge drinking, smoking in the last 12 months, history of hypertension, and parental history of hypertension) were assessed using Chi-square tests. Univariable Poisson regression was used to assess the association between hypertension and continuous variables (e.g., age). The results were presented as prevalence ratios (PR) with 95% confidence intervals. A p-value smaller than 0.05 was considered statistically significant.
Multivariable Poisson regression was used to identify independent factors associated with hypertension. All Poisson regression models (including univariable models) were fitted using a log link function. To account for potential overdispersion and violation of the equidispersion assumption, robust (sandwich) standard errors were applied. A stepwise backward elimination approach was applied: All variables with p-value smaller than 0.20 in univariable analysis were initially included. The variable with the highest p-value was removed sequentially until all remaining variables had p-values smaller than 0.05. Multicollinearity assessed via Variance Inflation Factor (VIF); VIF smaller than 5 was considered acceptable. Model comparison and model selection were guided by Akaike Information Criterion (AIC) and Bayesian Information Criterion (BIC), with lower values indicating better fit. Overfitting was assessed by calculating the area under the receiver operating characteristic curve (ROC-AUC). The final model was selected based on a combination of statistical performance and interpretability.
The STROBE guidelines for cross-sectional studies were followed for reporting this study [17]. The checklist can be found in Supplemental Table 2.
3. RESULTS
The study population was distributed evenly by sex and age group. The average age of participants was 44.4±12 years. A high proportion of participants were farmers (95.1%), and Catholicism was the most prevalent religion (68.6%), followed by Protestantism (19.8%). The majority of participants had completed primary school or lower levels of education (53.9%). Most participants had a normal weight (70.7%), while 61.3% were classified as having a high-risk waist-to-hip ratio. Regarding lifestyle factors, 36.0% of participants reported consuming a salty diet. Alcohol consumption within the past 12 months was common (57.9%), whereas smoking was less prevalent (12.8%). The prevalence of binge drinking was 39.6%. A history of hypertension was reported by 17.4% of participants, and 13.1% reported a parental history of hypertension. The overall prevalence of hypertension among participants was 31.7% (Table 1).
Univariable analysis revealed that Protestantism was associated with a higher prevalence of hypertension compared to Catholicism. Individuals with occupations other than farming also had a higher proportion of hypertension than farmers. Higher educational attainment was associated with a reduction in prevalence of hypertension. Participants who were overweight or obese had a greater proportion of hypertension compared to those with normal weight. Those who reported smoking within the past 12 months had an increased prevalence of hypertension compared to non-smokers. Additionally, individuals with a parental history of hypertension were significantly more common to have hypertension than those without such a history. All these associations were statistically significant (p<0.05) (Table 2).
Multivariable Poisson regression analysis was conducted to assess the independent associations between variables and the presence of hypertension while controlling for potential confounders. Age was significantly associated with an increased prevalence of hypertension in both crude and adjusted analyses. Specifically, each one-year increase in age was associated with a 4% higher prevalence of hypertension (adjusted PR: 1.04; 95% CI: 1.03–1.06; p<0.001). Compared to Catholicism, Protestantism remained significantly associated with a higher prevalence of hypertension (adjusted PR: 1.80; 95% CI: 1.27–2.56; p=0.001). Being overweight or obese was also significantly associated with a 1.45-fold higher prevalence of hypertension (95% CI: 1.07–1.97; p=0.016), while underweight status was associated with a non-significant increase in hypertension in both crude and adjusted models. A salty diet was significantly associated with an increase of hypertension in the adjusted model (adjusted PR: 1.46; 95% CI: 1.10–1.95; p=0.010). Binge drinking also emerged as a strong and significant risk factor for hypertension in the adjusted model (adjusted PR: 1.69; 95% CI: 1.26–2.29; p<0.001). Parental history of hypertension remained a strong and significant predictor, with substantially increased proportion observed among individuals with a family history of hypertension (adjusted PR: 2.08; 95% CI: 1.46–2.98; p<0.001). Although occupation and smoking status were associated with a higher prevalence of hypertension in the crude model, these associations were not significant in the adjusted model (p>0.05) (Table 3).
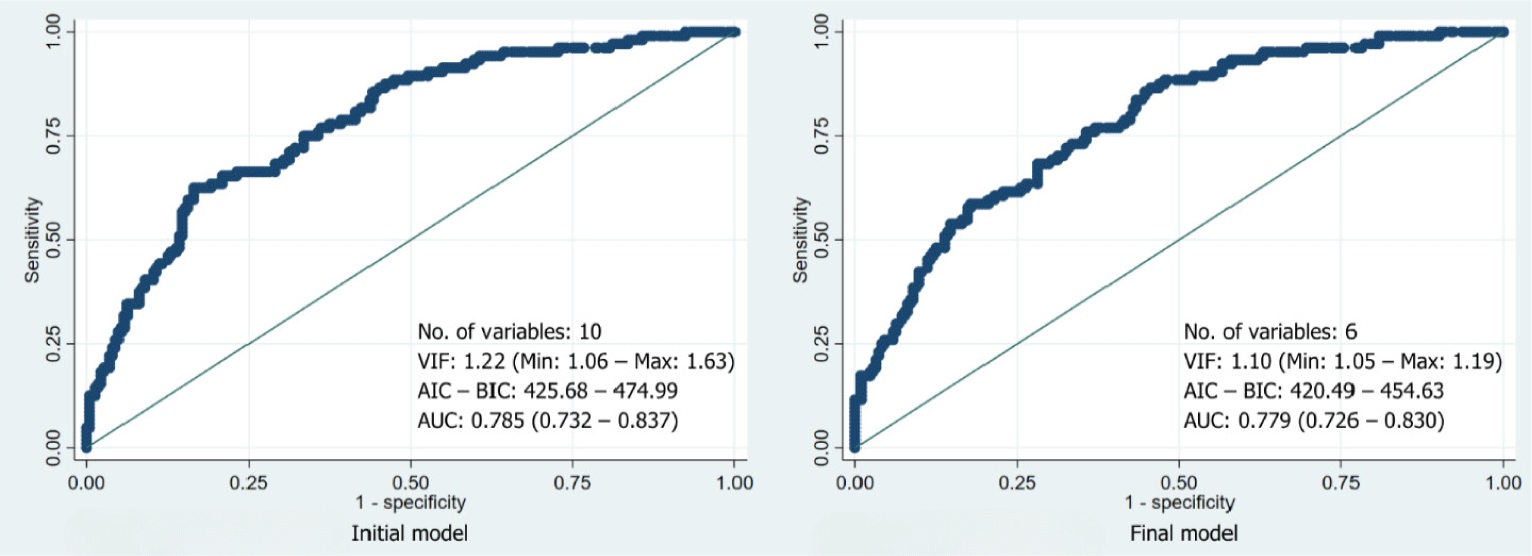
Fig. 3 summarizes the diagnostic characteristics of the initial and final multivariable Poisson regression models. The final model included seven variables, reduced from ten in the initial model, with similar multicollinearity statistics (mean VIF=1.21, range: 1.05–1.51), indicating no significant multicollinearity (Supplemental Table 3). Model fit improved slightly, with lower AIC and BIC values in the final model. Both models demonstrated acceptable discriminative ability, with ROC-AUC values of 0.785 for the initial model and 0.779 for the final model, suggesting minimal loss of predictive performance despite variable reduction.

4. DISCUSSION
The prevalence of hypertension among ethnic minority groups in Vietnam poses a significant public health concern, underscoring disparities in health outcomes across demographic populations. In this study, the prevalence of hypertension among K’Ho adults aged 25–64 was 31.7%, notably higher than the national average of 21.1% [2]. This finding aligns with previous studies reporting elevated hypertension rates among other ethnic minority groups, including the Cham (31.5%) and Khmer (33.5%) [18,19]. Similarly, research conducted in a mountainous region of Northern Vietnam, predominantly inhabited by the Thai ethnic group, found a hypertension prevalence of 30.0% [6]. Vietnam is home to 54 ethnic groups, with the Kinh majority accounting for approximately 86% of the population [20]. Ethnic minority communities, often living in remote and underserved areas, face numerous socioeconomic challenges and bear a disproportionately high burden of health issues, including hypertension [21]. Contributing factors may include limited access to healthcare services, lower levels of health literacy, and systemic inequity. In particular, community awareness of hypertension, the quality of physician–patient relationships, medication adherence, and broader health system barriers are critical issues that warrant attention [21]. Our finding highlights the urgent need for targeted public health interventions aimed at reducing the risk of hypertension in Vietnam’s ethnic minority populations. Strategies should prioritize addressing socioeconomic inequality, expanding healthcare access, and enhancing health education in these communities.
The final multivariable model was selected based on a balance between model parsimony and diagnostic performance. Compared to the initial model, the final model retained fewer variables (six versus ten), reducing model complexity without compromising predictive accuracy. Multicollinearity remained minimal, with similar mean VIF values, indicating model stability and reliable estimates. Furthermore, the final model demonstrated superior fit, as evidenced by lower AIC and BIC values, while maintaining comparable discriminatory power (AUC-ROC). These metrics supported the selection of the final model for interpretation, providing an optimal balance between simplicity and explanatory capacity.
Our study confirmed the strong and consistent association between age and hypertension risk, which is consistent with prior research [22,23]. This relationship is more likely to reflect age-related physiological changes, including arterial stiffening [22]. Epidemiological data also show that systolic blood pressure tends to rise continuously with age, while diastolic pressure follows a U-shaped trajectory, peaking in midlife [24]. Socioeconomic and environmental factors, such as residence and healthcare access, may further influence this association [25]. These findings reinforce the importance of age-specific strategies for hypertension screening and management, especially among middle-aged and older adults.
A notable finding in our study was the higher risk of hypertension among Protestants compared to Catholics. This result may indirectly align with previous research in African American populations, which suggested a link between certain religious affiliations (e.g., Protestantism) and obesity—a known hypertension risk factor [26]. Our supplemental analysis supported this explanation, revealing a higher prevalence of overweight/obesity among Protestants (33.9%) than Catholics (21.4%) (PR: 1.25; 95% CI: 1.01–1.56; p=0.043). Nonetheless, the association between religion and hypertension may also reflect confounding socioeconomic or behavioural differences. While religious affiliation can promote positive health behaviours, it may also influence attitudes toward medical care [27,28]. Future research should explore the complex interplay between religion, lifestyle, and health outcomes, and inform culturally appropriate interventions.
The association between overweight/obesity and hypertension risk observed in our study aligns with a substantial body of evidence [29–31]. Numerous meta-analyses confirmed a dose-response relationship between increasing BMI and hypertension risk, underscoring its significance as a modifiable factor [32]. Our findings emphasize the urgent need for public health strategies focused on obesity prevention and weight management.
Regarding lifestyle factors among participants, high dietary sodium intake was another significant risk factor identified, consistent with prior evidence linking salt consumption to elevated blood pressure and increased cardiovascular risk [33–35]. In accordance with WHO guidelines, limiting daily sodium intake to less than 2 grams is critical for hypertension prevention and control [36]. Binge drinking was also associated with a substantially increase of hypertension in our study, with an adjusted PR of 1.72. This result is supported by extensive literature indicating a direct, dose-dependent relationship between alcohol intake and blood pressure elevation [37,38]. These findings underscore the need to integrate alcohol risk mitigation into hypertension prevention strategies and clinical guidelines.
Parental history of hypertension emerged as a strong and consistent predictor, consistent with previous studies that have identified genetic predisposition and familial aggregation as key contributors to blood pressure regulation [39,40]. This is particularly concerning in youth populations, where a family history can double the risk of early-onset hypertension [41]. Our findings highlight the importance of early identification and targeted prevention in individuals with a familial risk and underscore the value of further genetic and longitudinal research.
While our study confirms well-established hypertension risk factors, several limitations warrant consideration. One limitation is the cross-sectional design, which restricts causal inference, precluding conclusions about the temporal sequence of our interested factors and hypertension status. Another limitation is that the study was conducted in a single commune in Vietnam, which may affect the generalizability of our findings. Our study employed cluster sampling but did not adjust the sample size to account for the design effect, which may have introduced bias or reduced the statistical power of the analysis. Even though the anthropometric measurements were taken using standardized tools and procedures, the structured questionnaire used in our study was self-developed and not adapted from any previously validated questionnaire. Although the items were built based on risk factors identified from the relevant literature, this may limit the reliability and comparability of some findings, particularly those based on self-reported behaviours. Future studies should consider using or adapting standardized and validated tools to enhance measurement accuracy and allow for cross-study comparisons. Additionally, because measurements were conducted at participants’ homes at varying times of day depending on their availability, this may have introduced measurement bias, particularly for blood pressure, which is known to follow circadian rhythms. The lack of standardized timing could have affected the accuracy and comparability of measurements across participants, potentially influencing the reliability of analyses related to hypertension. The notably association between religious affiliation and hypertension also requires further exploration to elucidate underlying behavioural or psychosocial mechanisms.
5. CONCLUSION
Effective prevention and control of hypertension among the K’Ho ethnic minority requires a multidimensional approach. Public health strategies should prioritize promoting healthy dietary habits, encouraging approaches for weight management, reducing sodium intake, and limiting alcohol consumption. Early identification and intervention are particularly important for individuals with a family history of hypertension. Given the observed associations with religious affiliation, further research is warranted to explore how religious beliefs and practices may influence health behaviours and hypertension risk. Additionally, continued investigation into the genetic, environmental, and lifestyle determinants of hypertension is necessary to inform more personalized risk assessment and targeted prevention strategies.


